My analysis now gives NWBO's DCVax-L a 14 month mPFS vs 8 month for its control. This gives DCVax-L a 6 month benefit which is larger than the 4 month benefit required to show statistical significance.
This new analysis uses an 8 month SOC PFS assumption and an enrollment ramp assumption (generated by i-hubbers Flipper44 & Rkmatters).
I created this simple model to try and predict how NWBO’s Phase 3 clinical trial is performing.
I consider this model at best a “rough-estimate”, from an engineer’s perspective (not a mathematician).
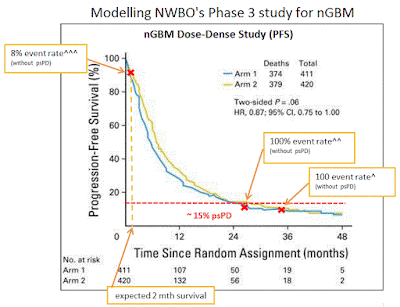
I used the Dose-Dense Temozolomide for newly diagnosed Glioblastoma study (D-D) as a foundation for this model. NWBO’s vaccine (DCVax-L) is getting compared to today’s SOC which is this D-D study (Arm1). The D-D study examined an increased chemotherapy dosing schedule to the original Stupp SOC. This study showed no efficacy statistical difference between the two treatments.
My model begins by assuming NWBO’s vaccine is ineffective, meaning that it has the same efficacy as the D-D study. The model uses the D-D study’s Kaplan-Meier chart (K-M) to estimate when NWBO’s trial can be expected to reach its primary completion date. Note, NWBO’s trial has not reached its primary completion dated, it is “on-going” and “nearing completion” according to the company’s more recent statements. In early Oct'16 the trial's primary completion date was moved to Nov'16 suggesting the company expects 248 PFS events to occur around that date.
I made a change to the D-D K-M chart so that it better represents NWBO’s trial patient population. The D-D study included a class of patients know as pseudo progressive (psPD) whereas the NWBO trial has excluded these patients. PsPD patients are believed to be the best GBM survivors and can make-up over 20% of the entire GBM population. So for my analysis I have disregarded the 15% longest survivors from the D-D study, assuming they will mainly be psPD patients.
I used publicly shared enrollment ramps from i-hubbers Rkmatters & Flipper44. With the enrollment ramp information and the PFS rates from the D-D K-M chart I was able to determine patient expected survival times. Using those survival time, I could then calculated the expected trial primary completion date, 248 PFS events. This would be the point at which the trial would end had all patients only received SOC treatment, note the trial has not reached its completion date as of Oct'16.
Should NWBO's trial reach its primary completion date in November 2016, my model gives NWBO a 14 month advantage over the D-D study.
However NWBO’s advantage is made-up from two portions, its treatment (DCVax-L) and its control.
To determine the benefit from the treatment portion of the trial an assumption was made about the benefit from the control portion. I have given NWBO's control an 8 months median PFS time which is longer than the D-D study's 5.5 months.
My reasoning for expecting longer PFS in NWBO's trial is based on the fact their patients have better outcome prognostics ie more tumor removed, higher KPS etc.
NWBO control patients are likely to see survival times closer to the Celldex's Rintega nGBM trial where all patients received complete tumor resections. Unfortunately Celldex has not shared their trial's K-M PFS data but they have shared their overall survival data. Rintega patient's median overall survival improved by around 40% from historical studies, 21months vs 15 months. Assuming PFS also improves by a similar 40% then NWBO's control can expect to have an 8 month mPFS (5.5 x 1.4 = ~8).
Using NWBO’s trial randomization ratio and an 8 months mPFS assumption for its control I was able to calculated the likely DCVax-L mPFS benefit (1/3 * 8 + 2/3 * DCVax-L = 12).
My model gives DCVax-L a 14 months mPFS vs 8 months for its control. So DCVax-L has a 6 month benefit which is larger than the 4 month benefit required to show statistical significance.


